Assess Your Product Test Strategy
Published on October 5, 2019 by Vijay Koteeswaran, Founder & Director at Qutrix
Numerous articles, case-studies and papers have been published by amateurs to experts for delving into the topic of how to build the right product and getting it right so you can go to market the way the company wants it to be and the way your customers wish it to be.
Are You Bullseye-Blind or Bullseye-Gold?
This is a small attempt to explore the role of test strategy in product engineering and the importance of assessing its efficiency. I intend to keep it simple by emphasizing the need to connect the dots by looking at certain existing metrics. Perhaps, this can be a catalyst to one’s thinking process towards improving the product quality and customer experience.

When the sleeves are rolled up for handling customer escalations on field issues, the stakeholders can check if the product test strategy has really worked well in addition to other measures generally prescribed by company’s maturity model or defined set of process.
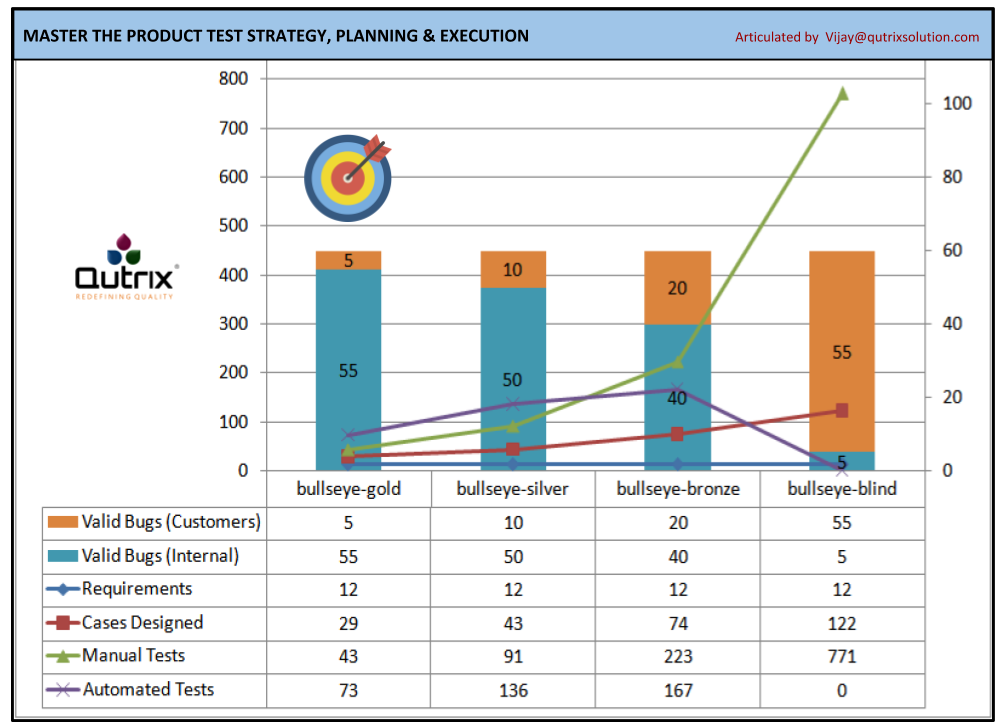
Have you ever checked to see your test operational quotient is “Bullseye-Blind” or “Bullseye-Gold” or ”Beyond”? Before we aspire to rate based on the obvious order given, let us together look into what is “Bullseye-Blind”. I request you to pay attention to the chart below and the sample metrics.
Please focus on the numbers shown in the column “Bullseye-Blind”. You might realize that,
- Internally reported valid defects are way LESS than customer reported
- Number of test cases designed for given requirements is significantly HIGHER
- Manual tests executed for overall test cases is HIGHER (6x of designed cases)
- Number of automated tests against manual tests/designed cases is NOTHING
Now, shift focus on the numbers shown in the column “Bullseye-Gold”. You might realize that,
- Internally reported valid defects are way HIGHER than customer reported
- Number of test cases designed for given requirements is significantly LOWER
- Manual tests executed for overall test cases is OPTIMAL (1.4x of designed cases)
- Number of automated tests against manual tests is OPTIMAL (1.7x of manual tests)
Rest of the categories shown in the chart is to help determine the current test operational efficiency in relative terms. One might observe that having more number of test cases or tests is not rated Gold. It is not about huge number claims but it is about achieving maximum efficiency with minimal. Of course, there are more than what is explained in the chart to include factors like code coverage, OPEX and etc.
If you are already operating at the efficiency of Bullseye-Gold, Congratulations! I just made you realize that you can aspire for Bullseye-Diamond. I have not shown Diamond in the chart as we often miss the ideal in the pursuit of perfection. Anything less than Gold is a reason to assess what is not working well. Without limiting at the process layer, deep dive to see the technical connections between the product, team, customers and process. Perhaps, the test strategist/architect mind can pull it together.
So, get your testing strategy well defined if none exists. Refine your testing strategy & implement it if not Gold. Thank your testing strategy & team if it is Gold but influence to go beyond, The Bullseye-Diamond.
Happy Testing -> Happy Customers -> Happy Developers -> Happy Management -> Happy Company!


